Losing Canadian Literacy
DESIGN ROLE
Art Direction
Data Visualization
Copywriting
Art Direction
Data Visualization
Copywriting
Course: COMD-218 Visualizing Information, Instructor: Natalie Gagnon
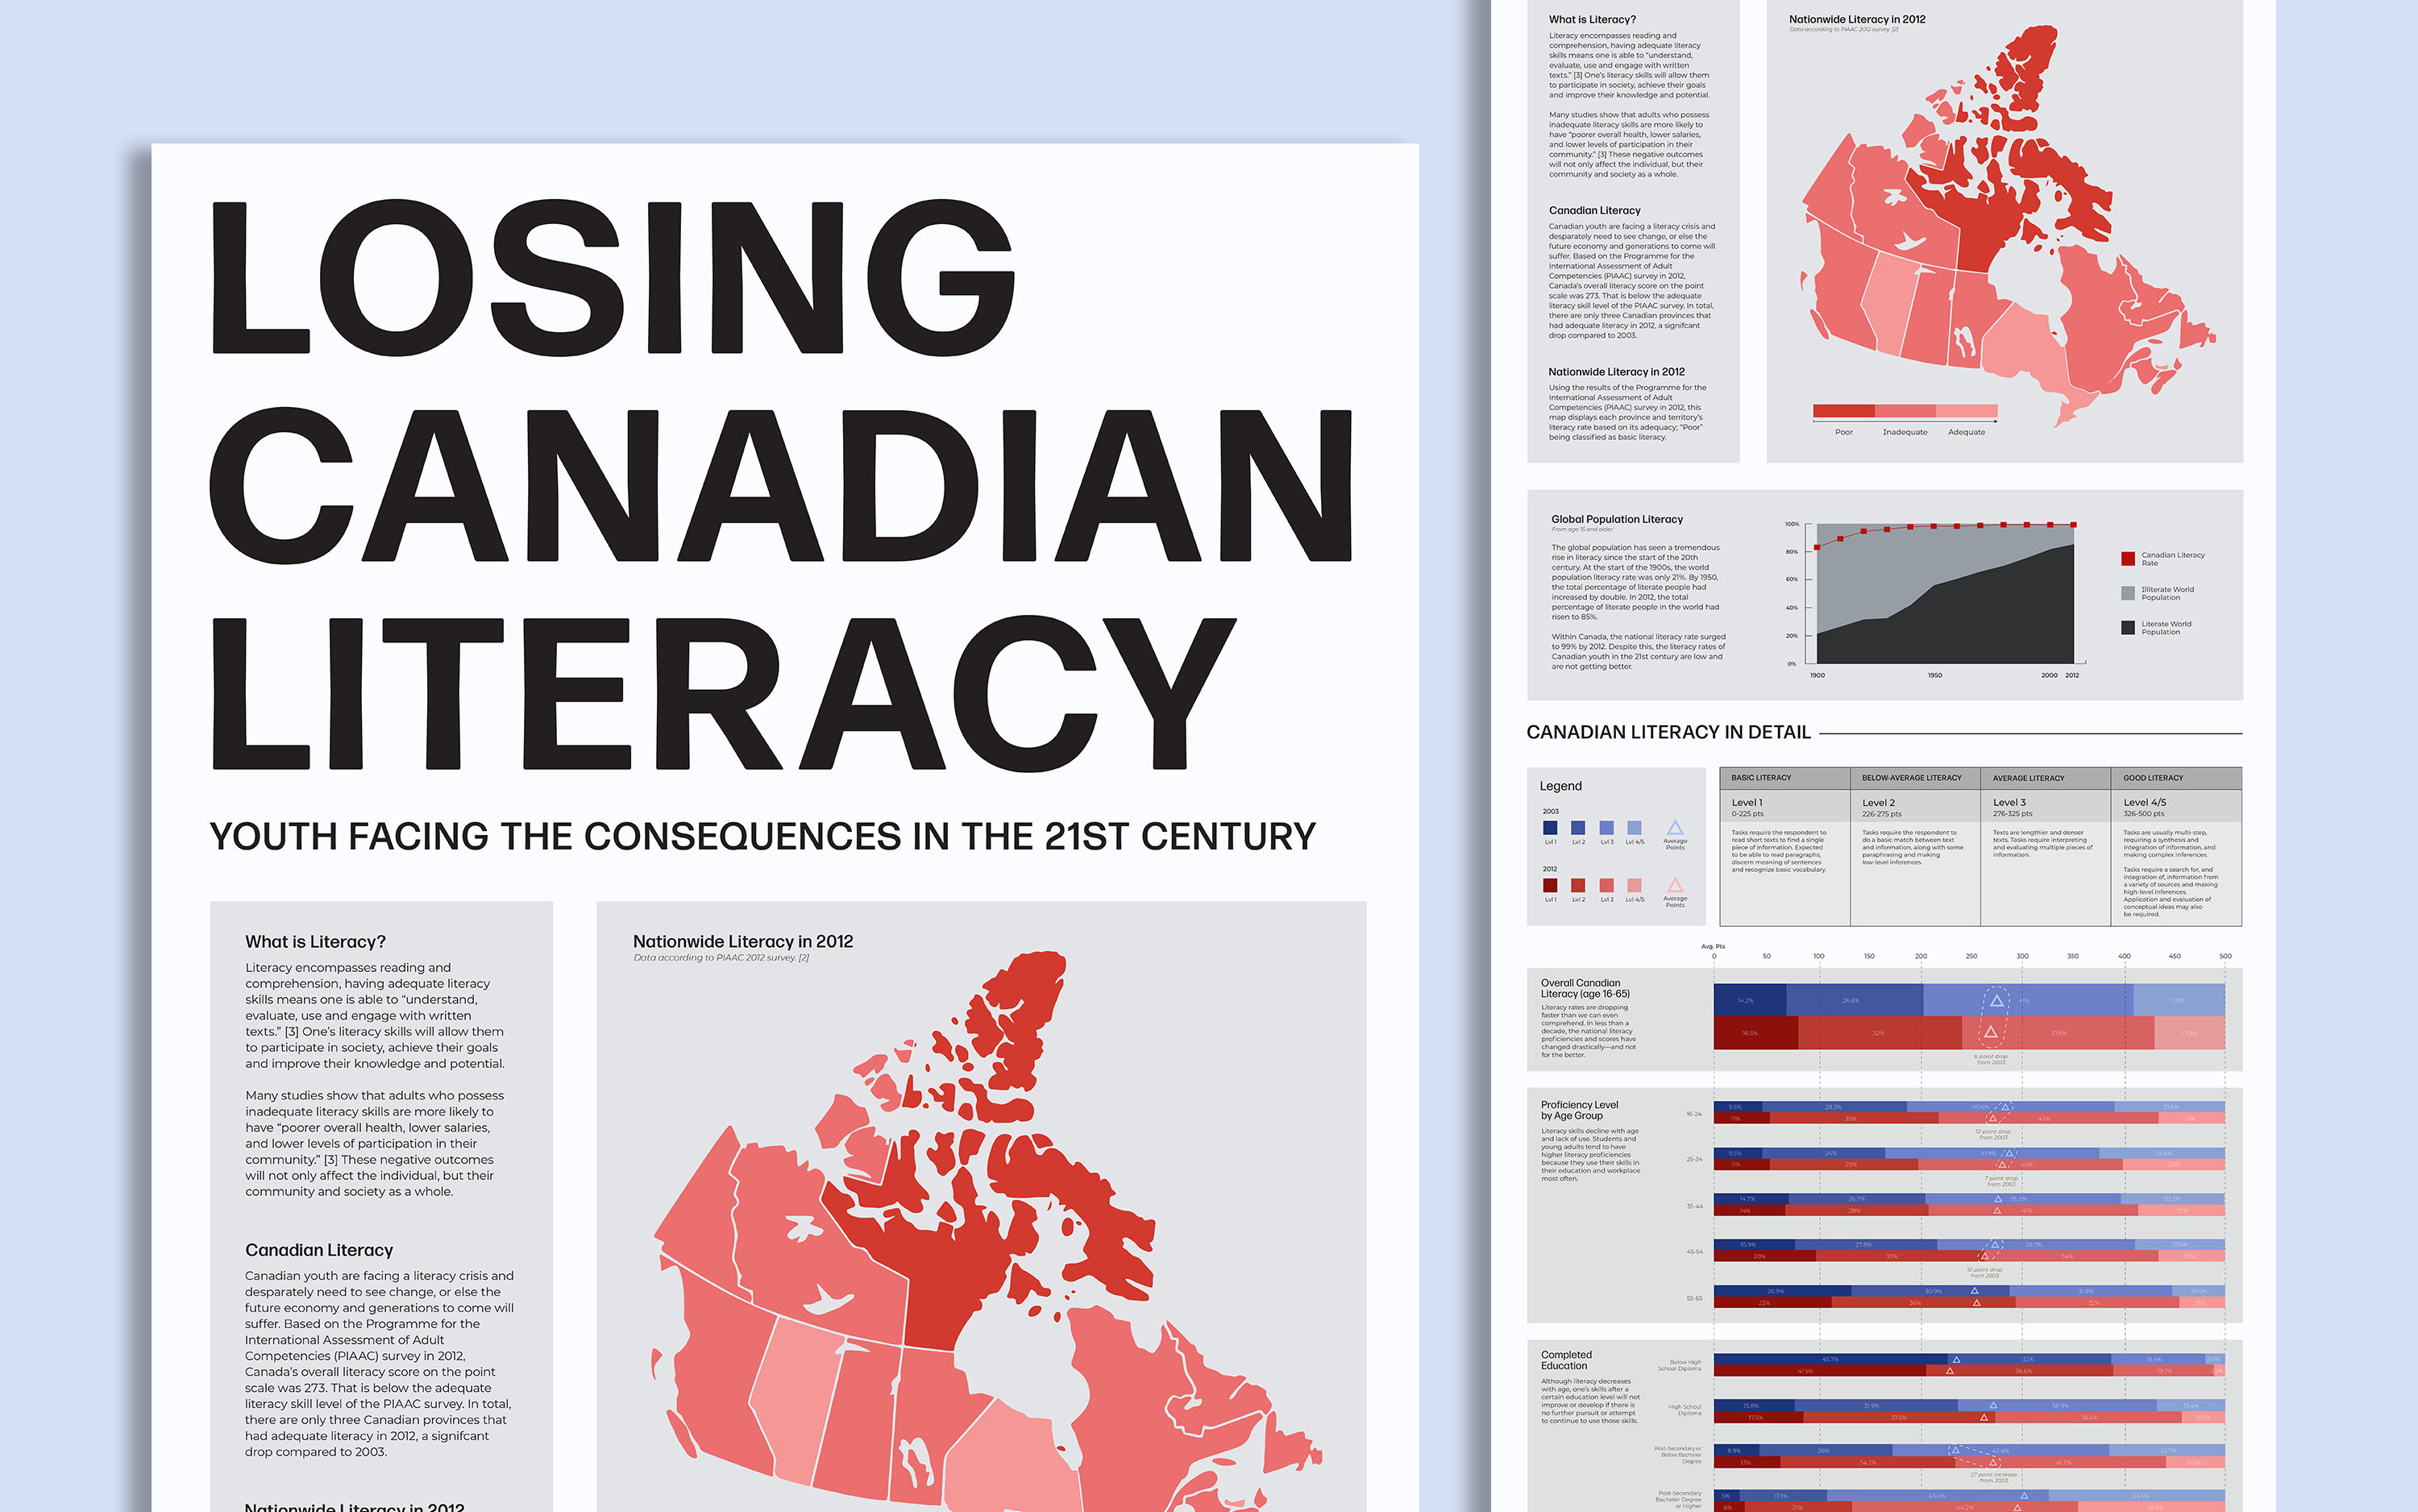
In April 2021, I had the chance to create an in-depth data visualization on Canadian literacy. I collected the necessary data and designed an infographic poster that compares the data from various tests done by the Organization for Economic Co-operation and Development (OECD) in 2003 and 2012. The primary data sets displayed show the proficiency levels of Canadians nationally, by age, labour force and education levels. This folded poster/pamphlet-style infographic takes a deep dive into what literacy looks like in various stages of life and what the consequences of low literacy can be, especially for younger generations.
In April 2021, I had the chance to create an in-depth data visualization on Canadian literacy. I collected the necessary data and designed an infographic poster that compares the data from various tests done by the Organization for Economic Co-operation and Development (OECD) in 2003 and 2012. The primary data sets displayed show the proficiency levels of Canadians nationally, by age, labour force and education levels. This folded poster/pamphlet-style infographic takes a deep dive into what literacy looks like in various stages of life and what the consequences of low literacy can be, especially for younger generations.
Take a closer look at the infographic PDF here.